Tactile maps and plans · 3D printed
Maps you read with your hands
Mountains rise under your fingers, coastlines have an edge you can follow, every border is a ridge you can trace end to end. Maps, routes and building plans, 3D printed for blind and low-vision readers, corrected by a blind reader's hands.
- From €150 for the ready-made set
- Reply in two days
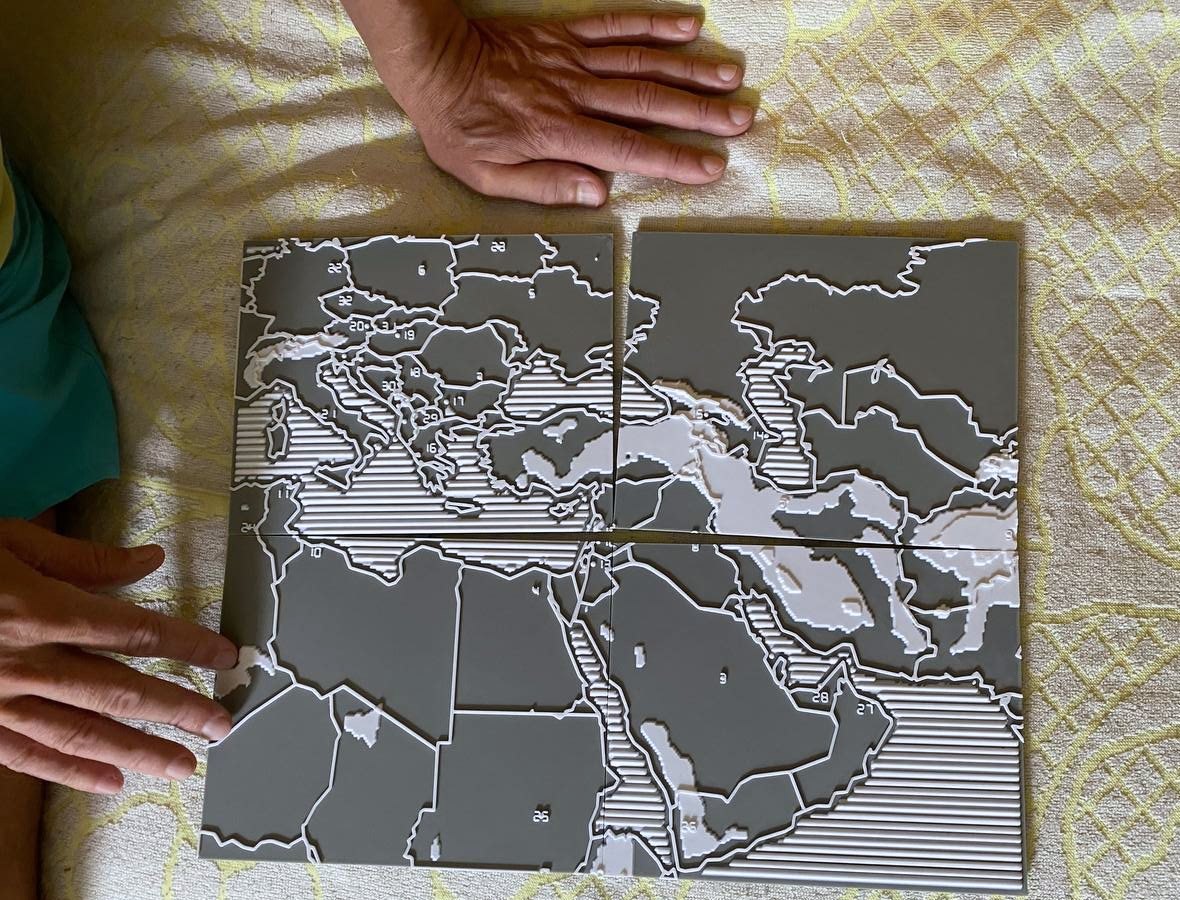 First print
The map in numbers
- 40 × 32 cm
- The whole map, in four tiles that dovetail together
- 4 levels
- Sea, lowland, plateau, mountains, 1 mm between steps
- 27 countries
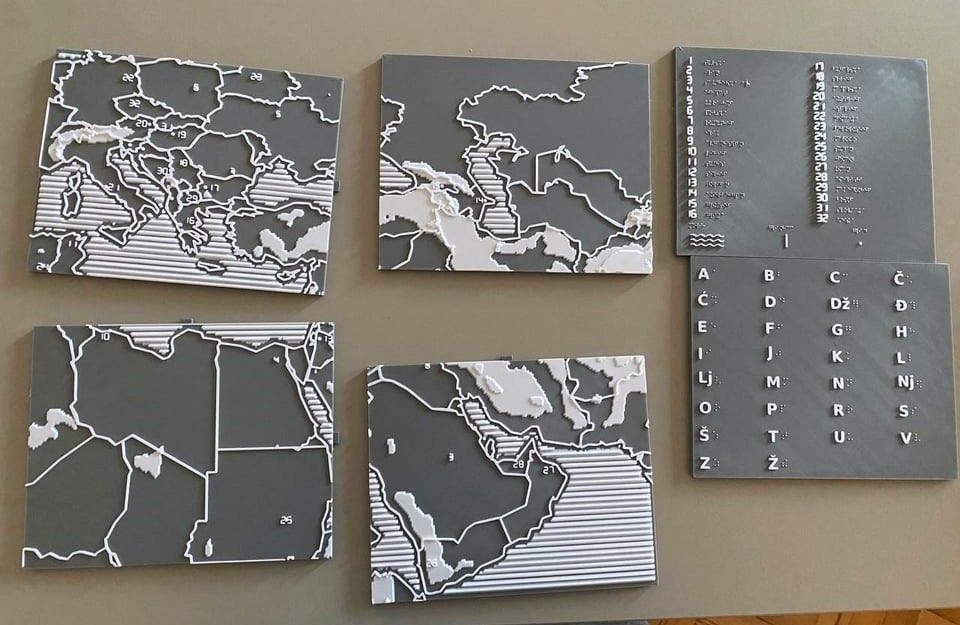
- Numbered on the map in braille, named on the legend card
- 2 alphabets
- English and Serbian braille, letter beside braille cell
What you can order
Not only maps
Anything with edges and levels can be built to read under a fingertip. The world map is one output of that pipeline, not the limit of it: one of the first things people asked for after it was the floor plan of a church.
A plan is the same problem as a map. Walls are the lines a finger follows, doors are the gaps in them, and a room needs a name you can read without asking anyone.
- A region or a country
- Any part of the world, at the scale that suits the reader: a continent to learn, or one country in detail.
- A city or a route
- A neighbourhood, a campus, the walk from home to school – the places someone needs to hold in their head.
- A building, room by room
- A church, a school, a station, a museum floor: what someone needs in their head before they can walk it on their own.
- A panel for an exhibition
- A tactile piece for a display case or a wall, with braille labelling, so a blind visitor gets the exhibit and not a description of it.
- A classroom set
- Several copies of the same piece, so a whole group can work at once instead of passing one around.
- Braille in another language
- English and Serbian Gajica are built. A new alphabet is a table of dot patterns, not a rewrite: send the language.
The design
What the hand actually feels
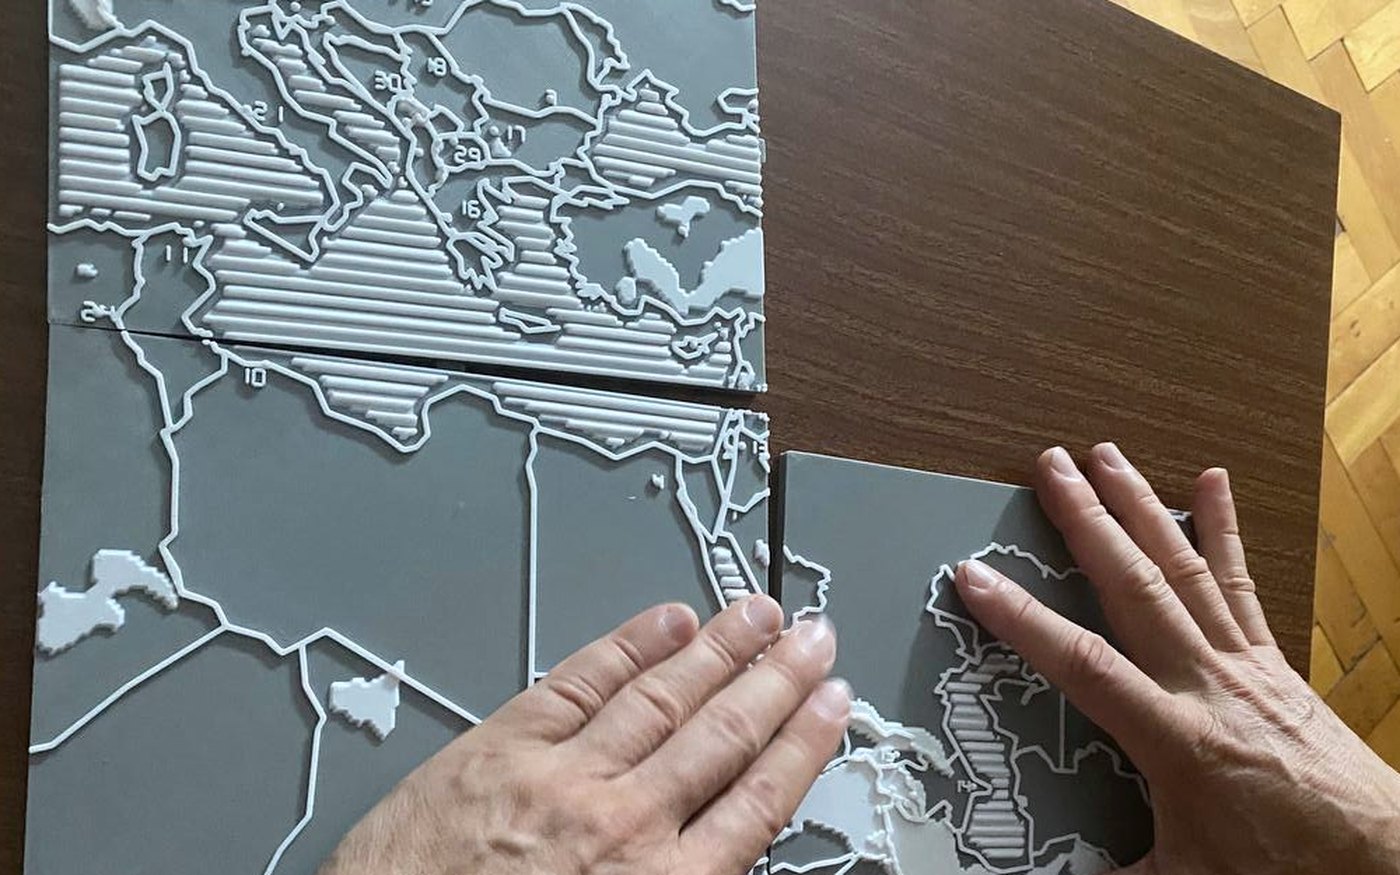
One decision shaped everything else: a border is a low ridge riding on top of the land, not a wall at a fixed height. An earlier version used tall walls, and they buried small lowland countries whole. Now a finger can follow a frontier and still feel the ground rise on either side of it.
- Terrain
- Four flat levels: sea, lowland, plateau, mountains – 0, 1, 2 and 3 mm
- Borders
- A ridge 1.2 mm above whatever it crosses, traceable end to end
- Seas
- Ribbed waves 2 mm high, unmistakable against flat land
- Labels
- Braille numbers, keyed to a separate braille legend card
- Orientation
- An anchor ridge left of every label marks its left edge and its rows
- Assembly
- Four 20 × 16 cm tiles, dovetailed: they drop in from above and cannot slide apart
Process
How it works
- You tell me what you need A region, a city, a route or a building. Who will read it, and how many copies. Three lines are enough to start.
- I send a price and a timeline A fixed price before any work begins. No hourly surprises.
- I generate and check the model The geometry is generated from real elevation, border or plan data by code I wrote, then verified to be a single watertight solid – the check a print shop cannot do for you.
- You get the piece Printed and shipped, or the print-ready files if you have your own printer.
Price
What it costs
Ready-made set
From €150
- Europe, the Middle East and North Africa
- Four map tiles, legend card, alphabet card
- English or Serbian braille
- Printed and shipped, shipping quoted separately
Made for you
Fixed quote
- Any region, city, route or building
- Scale and detail set for one reader
- Braille in your language
- Printed and shipped, or the print-ready files
Why it exists
It began as a present for a friend
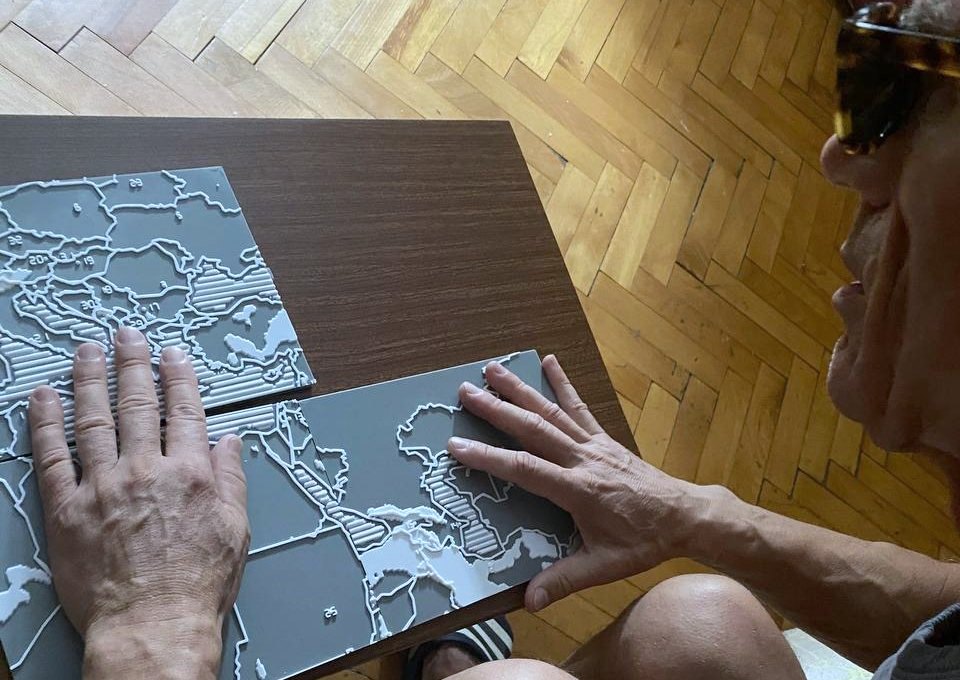
A friend of mine is blind. The maps he could get were flat printed sheets that tell your fingers almost nothing, or museum pieces you cannot take home. So I wrote code that turns real elevation and border data into something a hand can read, and printed him one.
He cried when he understood what he was holding. What I did not expect was which part held him: not the map, the braille. He had wanted to learn to read it for years and had never had the chance to sit down with someone and start. So now we work on it together, letter by letter. It is hard going, and he is getting somewhere.
This is my account of it, in my words rather than his.
For institutions
Schools, museums and public bodies
Buying from an individual maker is usually the awkward part. Work is invoiced from a registered business, with the documents your finance office expects, and for a run of copies you approve one printed piece, in your hands, before the rest are made.
Braille labelling is generated per language: Serbian Gajica braille, including Č Ć Dž Đ Lj Nj Š Ž, is already built and in use. Planning something for an exhibition or a school year? Write early – the time goes into design, not into printing.
Open source
The files are free
The map that started this is open source under the MIT licence, together with the code that generates it. If you have a 3D printer: print it, adapt it, give it away. No permission needed, nothing to pay.
Paid work is the part you cannot download – a region that does not exist yet, your language, your building, your classroom, printed and checked by someone who answers for it.
Read by hand, then rebuilt
What his hands found
Two defects, neither of them visible on my screen. Both were found by reading the first print with him, and both are fixed in the files this site ships.
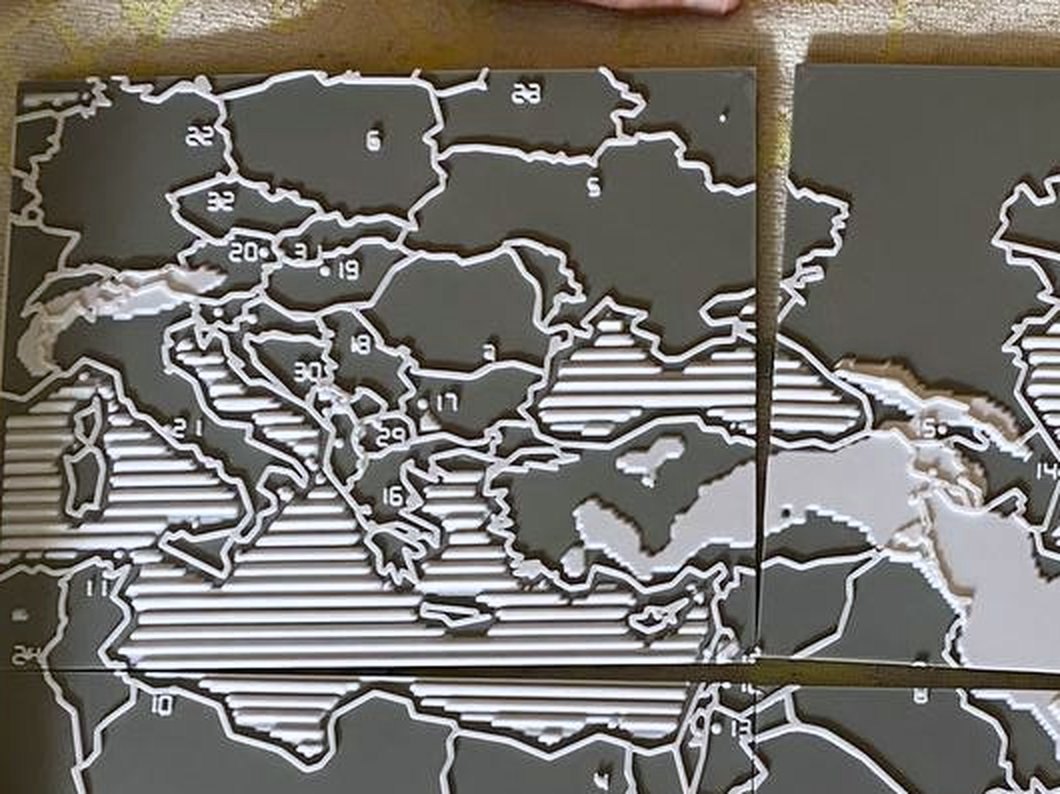
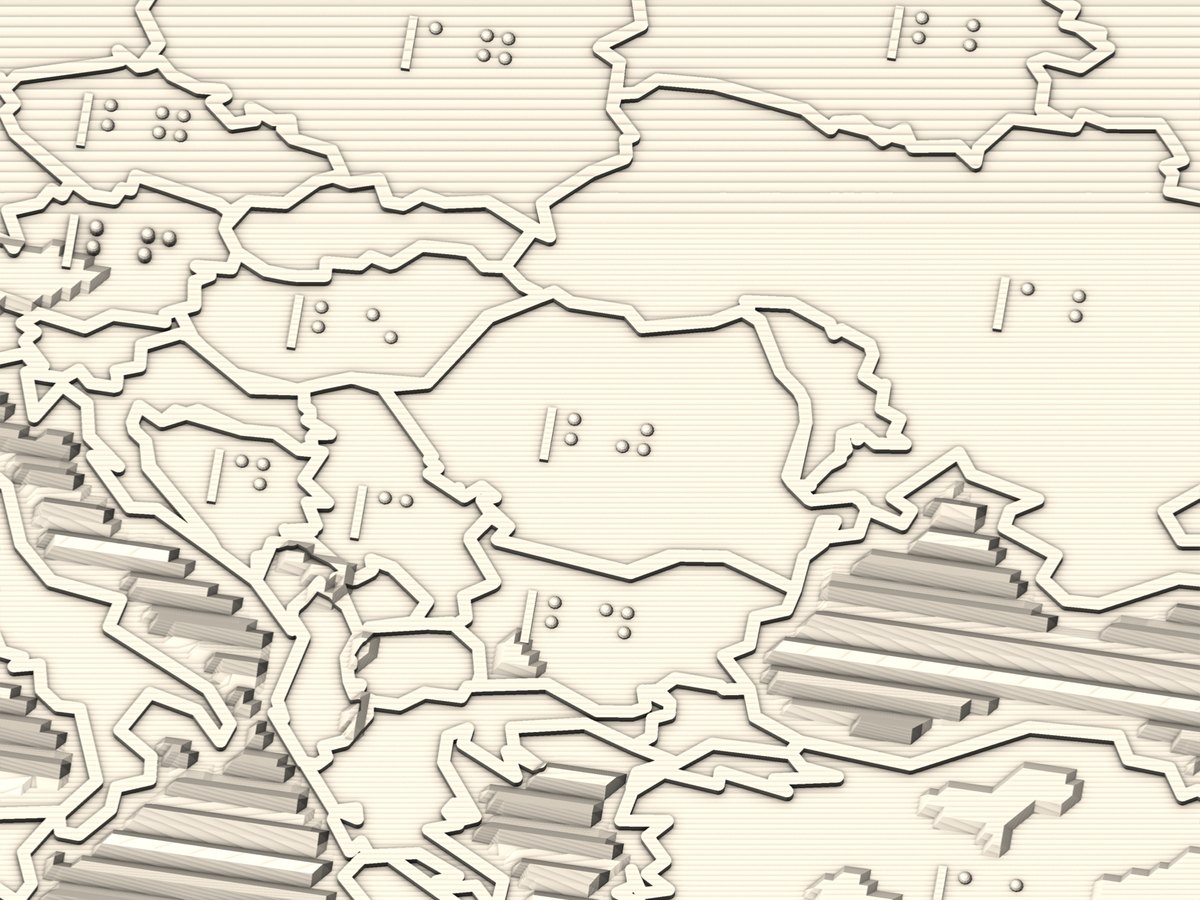
- Country numbers
- First printRaised Arabic digits. Somebody else had to read every one of them out loud.
- NowBraille numbers, keyed to the legend card, readable without asking anyone.
- The dots
- First printStandard dimensions printed as sharp points, so neighbouring dots blurred together.
- NowSmooth domes, 1.6 mm across and 0.8 mm high, on Marburg Medium spacing.
- Capital-city bumps
- First printA raised bump per capital, easy to mistake for a braille dot under a fingertip.
- NowGone, and the clear space a label needs around it came back with them.
- Finding a label
- First printA lone cell out on open ground, with no line and no left edge to start from.
- NowAn anchor ridge before every label marks its left edge and its top and bottom rows.
Every photograph on this site is the first print. The one render above is the only picture of the current geometry, because the second version has not been printed and photographed yet. When it has, the render goes and the photograph takes its place.
Who makes this
One person, and the friend it was made for
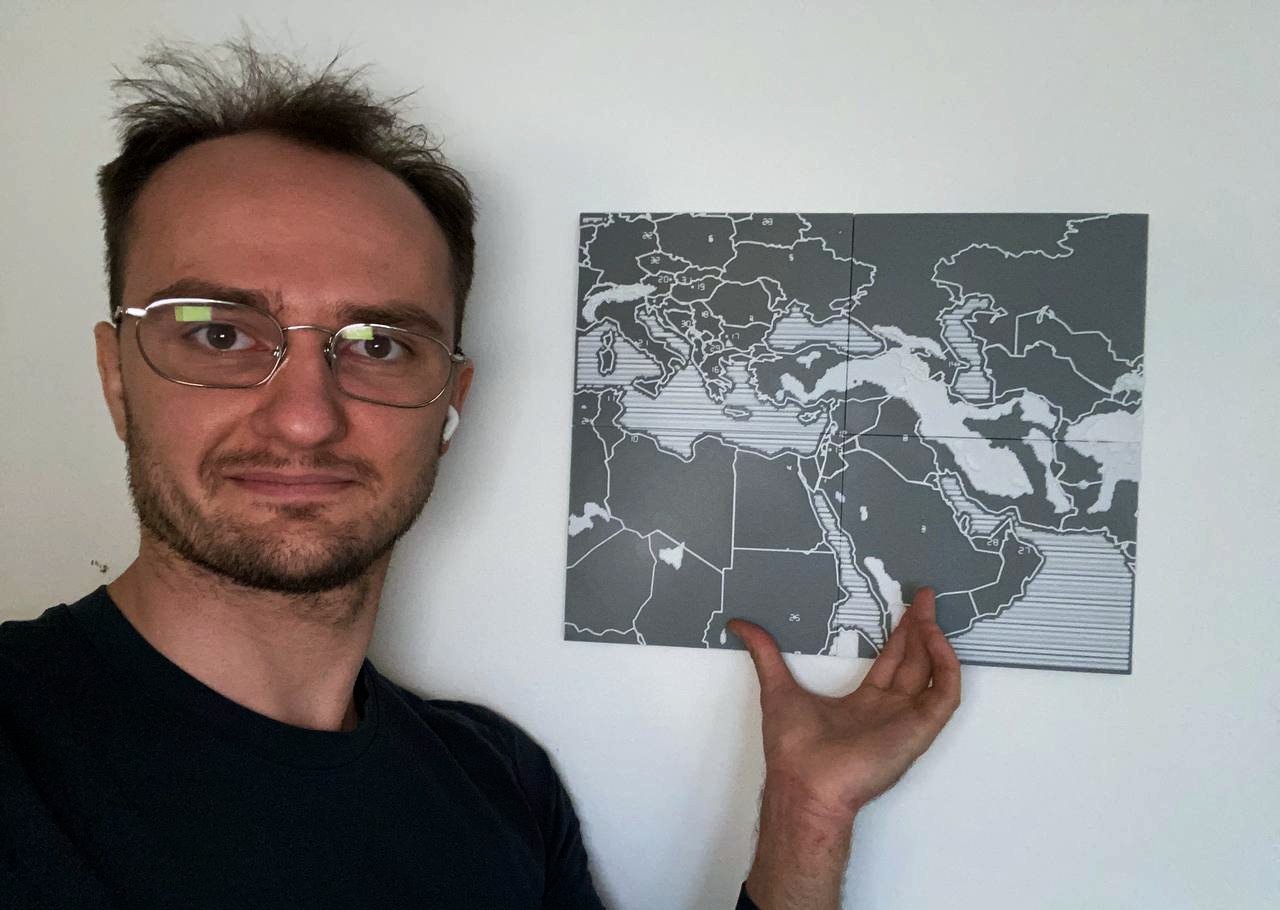
I am Gleb, a software engineer. I do not sculpt these by hand – I write the code that generates the geometry from real data, which is why a new region, city or building is a matter of days rather than months, and why every file can be checked for printability before it reaches a printer.
The other half of the work happens at a table with my friend, and it is the half that decides what gets built. You will deal with me directly, from the first email to the parcel.
Tell me what you need
A region, a city, a route, a building, a classroom set, or a language the braille does not speak yet. It arrives in my inbox and you get a price and a timeline back, usually within two days.